Introduction
Technical analysis is one of the most widely used methods of evaluating financial markets. Unlike fundamental analysis, which looks at economic and financial data, technical analysis focuses on price movements and chart patterns to make trading decisions.
In this guide, you will learn the basic principles of technical analysis, its core tools, how traders use it in different markets, and why it remains a critical skill for anyone involved in trading.
What is Technical Analysis?
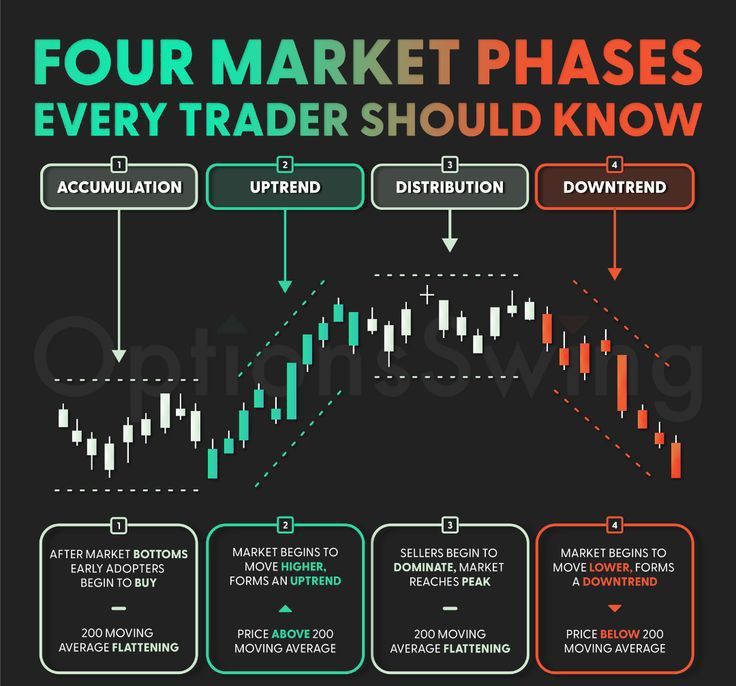
Technical analysis is the study of historical market data—primarily price and volume—to forecast future price movements. It operates on the belief that all known information is already reflected in the price, and that prices tend to move in trends.
Rather than asking why a market is moving, technical analysts ask how it is moving, and they seek patterns or signals to anticipate where it’s likely to go next.
Core Assumptions of Technical Analysis
There are three foundational beliefs behind technical analysis:
- The Market Discounts Everything:
All relevant information (economic, political, psychological) is already priced into the market. - Price Moves in Trends:
Markets often move in observable directions (up, down, or sideways) for extended periods. - History Repeats Itself:
Market participants behave in similar ways over time, creating repeating patterns on charts.
Why Use Technical Analysis?
Traders use technical analysis to:
- Identify entry and exit points
- Determine trend direction and momentum
- Set stop-loss and take-profit levels
- Filter out market noise
- Create structured, rule-based trading strategies
It is used across markets including forex, stocks, commodities, and crypto.
Price Charts: The Foundation of Technical Analysis
The most basic tool of technical analysis is the price chart. There are three main types:
1. Line Chart
- Shows a simple line connecting closing prices.
- Best for identifying overall trends.
- Easy to read, but lacks detail.
2. Bar Chart
- Displays open, high, low, and close (OHLC) prices.
- More detailed than line charts.
- Good for analyzing price range and volatility.
3. Candlestick Chart
- Similar to bar charts but more visually intuitive.
- Each candlestick represents price action during a specific time frame.
- Shows bullish or bearish momentum with color-coded candles.
Candlestick charts are the most popular among traders due to their clarity and ability to reveal patterns.
Key Tools in Technical Analysis
Here are the primary tools that technical analysts use:
1. Trendlines and Channels
- Help identify the direction and strength of a trend
- Drawn by connecting highs or lows on a chart
- Channels show price oscillating between two parallel lines
2. Support and Resistance Levels
- Support: price level where buyers step in
- Resistance: price level where sellers dominate
- Crucial for planning entries, exits, and risk management
3. Moving Averages (MA)
- Smooths out price data to identify trends
- Simple Moving Average (SMA) and Exponential Moving Average (EMA)
- Common periods: 50-day, 100-day, 200-day
4. Momentum Indicators
- Measure speed of price movement
- Examples: Relative Strength Index (RSI), Moving Average Convergence Divergence (MACD), Stochastic Oscillator
- Help identify overbought/oversold conditions
5. Volume Analysis
- Confirms the strength of a price move
- High volume on a breakout indicates conviction
- Volume indicators include On-Balance Volume (OBV), Volume Profile
Chart Patterns and Price Action
Patterns are formed by price behavior over time and can signal potential reversals or continuations.
Common chart patterns:
- Head and Shoulders
- Double Tops and Bottoms
- Triangles (Ascending, Descending, Symmetrical)
- Flags and Pennants
Understanding these can help traders anticipate breakout or breakdown levels.
Technical vs. Fundamental Analysis
| Aspect | Technical Analysis | Fundamental Analysis |
|---|---|---|
| Focus | Price, volume, patterns | Economic, financial data |
| Timeframe | Short to medium-term | Medium to long-term |
| Tools | Charts, indicators, patterns | Earnings reports, news, interest rates |
| Suitable for | Active traders, scalpers, swing traders | Long-term investors, position traders |
Many traders use a combination of both approaches for better insights.
Limitations of Technical Analysis
While powerful, technical analysis is not foolproof:
- Subjective: Pattern recognition can vary by trader
- No Guarantees: Indicators show probability, not certainty
- False Signals: Markets can be irrational or manipulated
- Lagging Tools: Some indicators react after the move has started
Discipline, risk management, and backtesting are essential to overcome these limitations.
How to Start Learning Technical Analysis
- Master Chart Reading: Start with candlestick basics
- Study Common Patterns: Repetition builds recognition
- Practice on Demo Accounts: Apply knowledge risk-free
- Keep a Trading Journal: Document trades and lessons
- Use a Reliable Platform: Choose tools with strong charting features
- Never Stop Learning: Technical analysis evolves with the market
Conclusion
Technical analysis is a foundational skill for traders of all markets. By learning how to read charts, recognize patterns, and apply indicators, you can make more informed and disciplined trading decisions.
While it requires study and practice, technical analysis gives traders the ability to respond to price action in real time. As you build experience, it becomes not just a method, but a mindset.
Whether you’re trading forex, stocks, or crypto, mastering technical analysis can provide a significant edge in today’s fast-moving markets.


