Introduction
Volume analysis is a core component of technical analysis that provides insights into the strength or weakness of price movements. By studying trading volume, traders can validate trends, identify potential reversals, and improve the accuracy of their trading strategies.
This article explains what volume analysis is, how it works, and how traders use volume to confirm price action in various market conditions.
What is Volume in Trading?
In trading, volume refers to the total number of shares, contracts, or lots traded during a given period. It represents the level of activity or participation in a market.
Higher volume typically means:
- More interest and participation in a price move.
- Stronger validation of the trend or breakout.
Lower volume often suggests:
- Lack of conviction.
- Potential for false signals or trend weakness.
Why Volume Matters in Technical Analysis
Volume gives context to price action. A price movement accompanied by high volume is considered more significant and likely to continue. Conversely, a move on low volume may be suspect and prone to reversal.
Key reasons volume is important:
- Confirms the strength of a trend.
- Identifies breakouts and fakeouts.
- Helps validate support and resistance levels.
- Reveals accumulation or distribution.
Basic Volume Principles
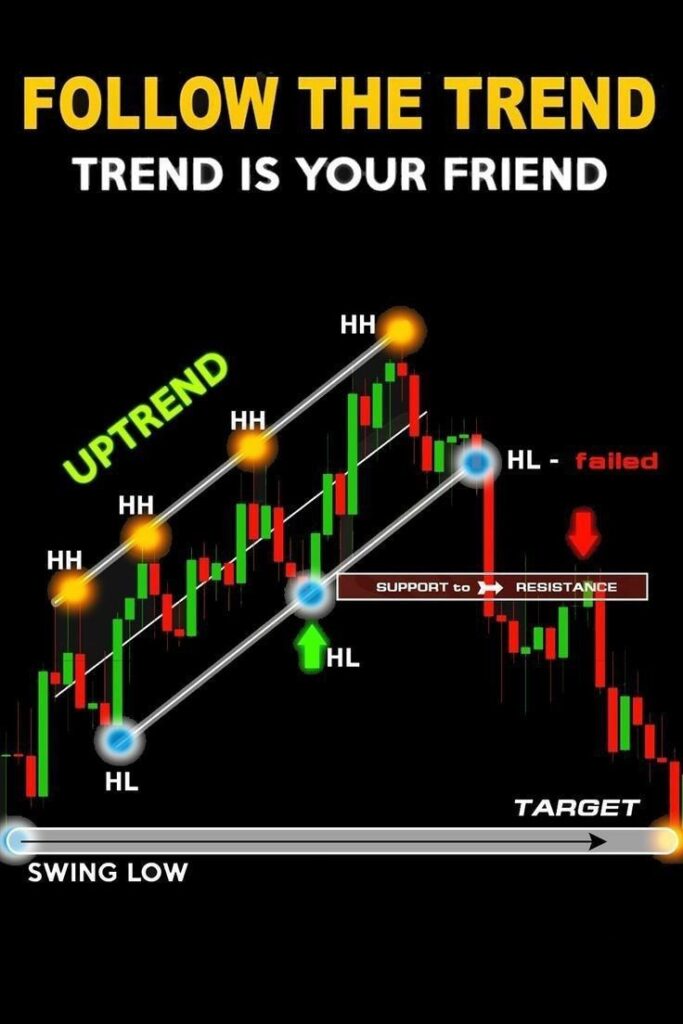
- Volume Confirms Trend
- In an uptrend, volume should increase as the price rises and decrease on pullbacks.
- In a downtrend, volume should rise during price declines and fall on rallies.
- Price Moves with High Volume Are More Reliable
- A breakout above resistance with high volume is more likely to hold than one with low volume.
- A reversal candle with high volume adds credibility to the signal.
- Divergence Between Price and Volume
- If price makes a new high, but volume does not confirm (e.g., lower volume), it may signal a potential reversal.
How to Read a Volume Bar Chart
Most platforms show volume as vertical bars below price charts:
- Each bar represents volume for that specific period (daily, hourly, etc.).
- Taller bars = more volume.
- Shorter bars = less volume.
Look for patterns in volume behavior relative to price movement to gain deeper insights.
Common Volume-Based Trading Strategies
1. Volume Breakout Strategy
- Wait for price to break key support/resistance with a surge in volume.
- Enter after confirmation, as high volume validates the breakout.
2. Volume Reversal Strategy
- Look for reversal candlestick patterns (e.g., pin bar, engulfing) accompanied by a spike in volume.
- High volume suggests a genuine shift in market sentiment.
3. Volume Divergence
- When price forms higher highs but volume declines, it signals weakening momentum.
- Often leads to trend reversals.
Using Volume with Other Technical Tools
1. Volume + Price Action
- Use volume to confirm candlestick patterns and chart formations.
- A hammer at support with rising volume is stronger than one with weak volume.
2. Volume + Indicators
- Combine volume with tools like RSI, MACD, or Moving Averages to improve signals.
- Example: Bullish MACD crossover with increasing volume = stronger signal.
3. Volume + Support/Resistance
- Watch how volume behaves near key zones.
- A resistance break with high volume is more likely to become new support.
Popular Volume Indicators
1. On-Balance Volume (OBV)
- Measures cumulative buying and selling pressure.
- Rising OBV = accumulation; falling OBV = distribution.
2. Volume Moving Average
- Smooths out volume fluctuations.
- Useful to compare current volume with historical average.
3. Chaikin Money Flow (CMF)
- Combines price and volume to show buying or selling pressure.
Practical Example: Volume Confirms Breakout
- Price consolidates under a key resistance level.
- Volume stays low during consolidation.
- Suddenly, price breaks above resistance with a spike in volume.
- The volume surge confirms real buying interest.
- Enter trade with stop below breakout zone and target higher resistance.
Limitations of Volume Analysis
- Volume data varies by market: In decentralized markets like Forex, volume is based on tick volume (number of price changes), not actual transactions.
- Lagging nature: Sometimes volume confirmation comes after the price has already moved.
- False spikes: Sudden news or large institutional trades may cause misleading volume.
Always combine volume with other tools to increase reliability.
Conclusion
Volume analysis is a powerful tool that helps traders understand the market’s commitment behind price movements. Whether you’re trading breakouts, trend continuations, or reversals, volume acts as a key confirmation tool. When integrated with other forms of technical analysis, volume can significantly improve trade timing and decision-making.
Understanding and interpreting volume effectively can be the difference between chasing false breakouts and riding strong trends with confidence.