Introduction
Fibonacci retracement levels are a widely used tool in technical analysis that help traders identify potential support and resistance zones. These levels are derived from the Fibonacci sequence and are used to predict possible price reversals, retracements, or trend continuations.
In this article, we’ll explore what Fibonacci retracement levels are, how they are calculated, how traders use them, and why they remain an essential component in technical trading strategies.
What is the Fibonacci Sequence?
The Fibonacci sequence is a series of numbers where each number is the sum of the two preceding ones:
0, 1, 1, 2, 3, 5, 8, 13, 21, 34, ...
The key Fibonacci ratios used in trading are derived from this sequence. The most common retracement levels are:
- 23.6%
- 38.2%
- 50% (not a Fibonacci number but widely used)
- 61.8%
- 78.6%
The 61.8% ratio, also known as the “Golden Ratio,” is particularly significant in technical analysis.
What Are Fibonacci Retracement Levels?
Fibonacci retracement levels are horizontal lines that indicate potential reversal areas where the price could pull back before continuing in the direction of the trend. These levels are drawn by identifying a major high and low on the chart and then dividing the vertical distance by the key Fibonacci ratios.
These levels are plotted on charts to help traders anticipate where a retracement might find support or resistance.
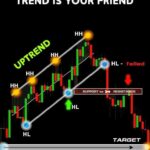
How to Draw Fibonacci Retracement Levels
- Identify the trend direction
- For an uptrend, draw from the swing low to the swing high
- For a downtrend, draw from the swing high to the swing low
- The trading platform will automatically generate the retracement levels.
- Use these levels to identify potential areas where price might reverse or consolidate.
Fibonacci Retracement Levels Explained
1. 23.6% Level
- Represents shallow retracements.
- Indicates strong trend momentum.
- Price may bounce quickly without deep pullback.
2. 38.2% Level
- A common pullback level in trending markets.
- Considered a moderate retracement area.
3. 50% Level
- Not officially a Fibonacci number but widely used.
- Represents a significant correction level.
- Market often respects this level during retracements.
4. 61.8% Level
- Known as the Golden Ratio
- Very strong potential reversal zone.
- Often signals the end of a retracement.
5. 78.6% Level
- Deep retracement level.
- May indicate possible trend exhaustion or false breakout.
How Traders Use Fibonacci Levels
1. Entry and Exit Points
- Enter trades near key retracement levels when price shows reversal confirmation.
- Set take-profit levels near the next Fibonacci zone or recent swing points.
2. Stop-Loss Placement
- Stops are often placed just beyond the next Fibonacci level to allow for volatility.
- For example, if entering on a bounce at 61.8%, stop might be placed below 78.6%.
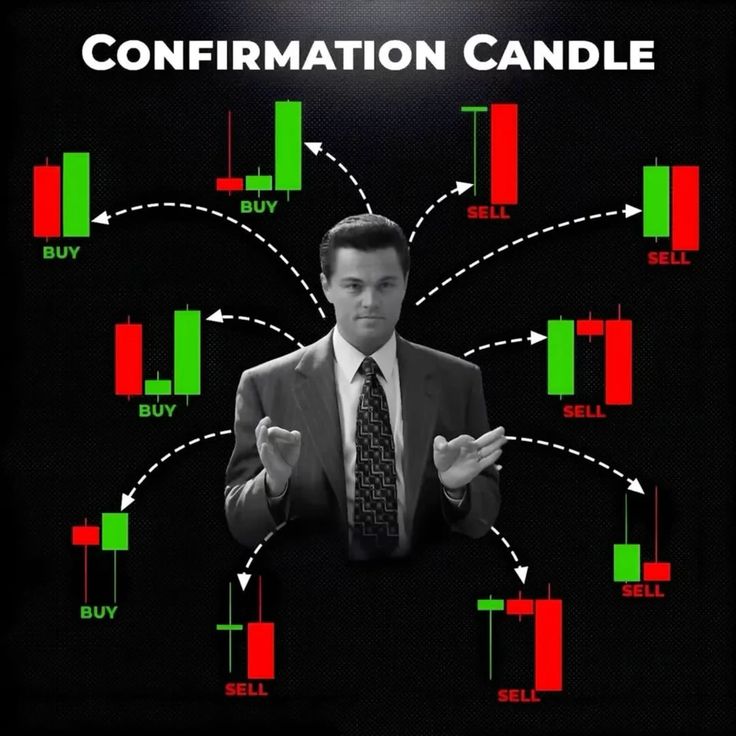
3. Combining with Candlestick Patterns
- Wait for reversal patterns (e.g., pin bar, engulfing) at Fibonacci zones for higher probability trades.
4. Combining with Other Tools
- Use alongside:
- Trendlines
- Support and Resistance
- MACD / RSI
- Volume Analysis
This combination strengthens trade setups and reduces false signals.
Fibonacci Retracements in Different Markets
Fibonacci levels are applicable across:
- Forex
- Stocks
- Cryptocurrencies
- Commodities
They are most effective in strong trending markets, less reliable in choppy or sideways markets.
Fibonacci Extension vs. Retracement
- Retracement Levels: Used to find potential pullbacks within a trend.
- Extension Levels: Used to predict future price targets beyond previous swing highs/lows.
Both tools are often used together to plan entry, stop-loss, and take-profit levels.
Limitations of Fibonacci Retracement
- Subjective Application: Different traders may choose different swing points.
- Not Standalone: Should always be used in conjunction with price action and other tools.
- False Signals: Market doesn’t always respect Fibonacci levels; price may break through or ignore them entirely.
Example Strategy Using Fibonacci Retracement
Step-by-Step Approach:
- Identify the trend.
- Draw Fibonacci retracement from swing high to low (or vice versa).
- Wait for price to approach a key level (e.g., 38.2% or 61.8%).
- Look for reversal candlestick pattern or confirmation.
- Enter the trade with stop-loss beyond the next Fibonacci level.
- Set target at previous high or next key level.
This provides a structured and disciplined entry framework.
Conclusion
Fibonacci retracement levels are a powerful tool in a trader’s toolkit. By helping to identify potential pullback zones, these levels can improve timing and risk management in trades. While not foolproof, when combined with other forms of technical analysis and proper confirmation signals, Fibonacci retracement becomes a reliable and insightful component of any trading strategy.
Always remember: practice, test, and adapt strategies based on market behavior and your trading style.