Introduction
Candlestick patterns are at the core of technical analysis and price action trading. Developed centuries ago by Japanese rice traders, candlesticks offer a visual representation of market sentiment. They condense crucial data—open, high, low, and close—into a single, easy-to-interpret bar on a chart.
In this guide, we will explore what candlestick patterns are, how they work, and how to use them to anticipate market moves. Whether you’re trading forex, stocks, or crypto, mastering candlestick patterns is essential for effective decision-making.
What is a Candlestick?
A candlestick represents price movement within a specific time frame (e.g., 1 hour, 1 day, 1 week). Each candlestick has the following components:
- Open: The price at the beginning of the period
- Close: The price at the end of the period
- High: The highest price reached during the period
- Low: The lowest price reached during the period
These elements form the body and wicks (or shadows) of the candle.
Bullish Candlestick:
- Close > Open
- Typically shown as green or white
Bearish Candlestick:
- Close < Open
- Typically shown as red or black
Why Candlesticks Matter
Candlesticks provide insights into:
- Market sentiment: Who is in control—buyers or sellers
- Momentum shifts: Potential reversals or continuations
- Price psychology: How traders react at key levels
Reading candlesticks helps traders understand the story behind the price movement, beyond just numbers.
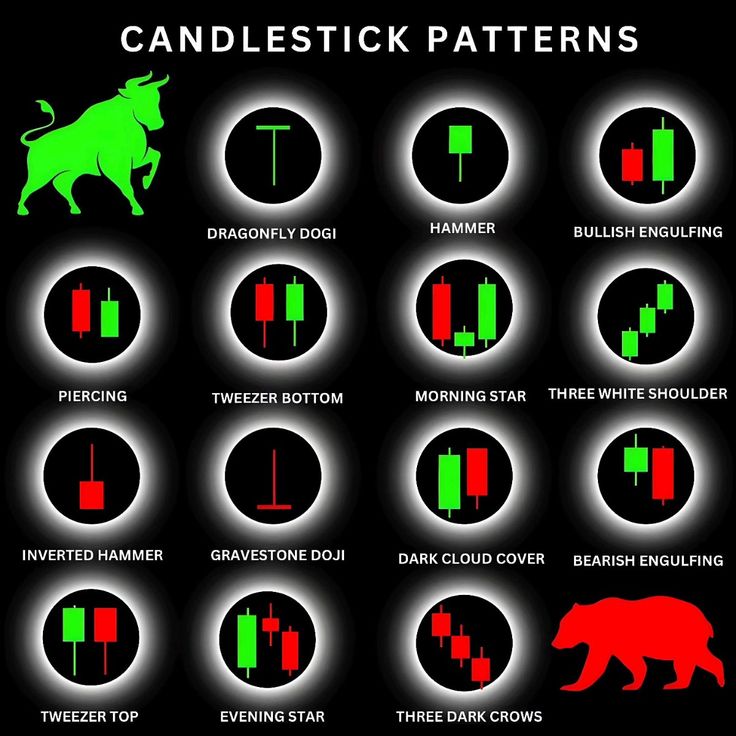
Single Candlestick Patterns
These patterns consist of a single candle and often indicate a potential reversal.
1. Doji
- Open and close are nearly the same
- Indicates indecision or a potential turning point
- Appears after trends and signals caution
2. Hammer
- Small body with a long lower wick
- Appears after a downtrend
- Bullish reversal signal
3. Inverted Hammer
- Small body with a long upper wick
- Also follows a downtrend
- Potential bullish reversal
4. Shooting Star
- Small body with a long upper wick
- Appears after an uptrend
- Bearish reversal signal
5. Spinning Top
- Small body with long upper and lower wicks
- Shows market indecision
- Not strong alone but valuable in context
Two-Candlestick Patterns
These patterns are made up of two candles and are more reliable than single-candle signals.
1. Bullish Engulfing
- Small red candle followed by a large green candle that “engulfs” it
- Appears after a downtrend
- Strong bullish reversal signal
2. Bearish Engulfing
- Small green candle followed by a large red candle that engulfs it
- Appears after an uptrend
- Bearish reversal signal
3. Tweezer Bottom
- Two consecutive candles with similar lows
- Appears after a downtrend
- Indicates strong support and reversal potential
4. Tweezer Top
- Two candles with similar highs
- Appears after an uptrend
- Bearish reversal signal
Three-Candlestick Patterns
These provide even stronger reversal or continuation signals.
1. Morning Star
- Bearish candle → Doji or small candle → Strong bullish candle
- Appears after a downtrend
- Bullish reversal signal
2. Evening Star
- Bullish candle → Doji or small candle → Strong bearish candle
- Appears after an uptrend
- Bearish reversal signal
3. Three White Soldiers
- Three long bullish candles in a row
- Appears after a downtrend
- Strong bullish continuation signal
4. Three Black Crows
- Three long bearish candles in a row
- Appears after an uptrend
- Strong bearish continuation signal
How to Use Candlestick Patterns in Trading
1. Always Use in Context
- Patterns are most reliable when they occur at key support/resistance levels or after a prolonged trend.
2. Combine with Other Tools
- Use indicators like RSI or moving averages to confirm the signal.
- Candlesticks alone are not sufficient for consistent decisions.
3. Timeframe Matters
- Patterns on higher timeframes (daily or weekly) are generally more reliable than those on lower timeframes.
4. Wait for Confirmation
- Don’t act immediately on a pattern. Wait for the next candle or volume confirmation before entering a trade.
5. Use Proper Risk Management
- Set stop-losses based on the pattern structure.
- Don’t over-leverage based on one signal.
Common Mistakes to Avoid
- Ignoring the trend direction: Reversal patterns are less reliable in strong trends.
- Forcing patterns: Not every candle formation is a valid signal.
- Overtrading: Relying solely on candlesticks without strategy or analysis.
- Skipping confirmation: Acting too early leads to false signals and losses.
Conclusion
Candlestick patterns are a powerful language used by traders to interpret market sentiment and price direction. While they are not a crystal ball, they offer essential clues when used correctly and in conjunction with other tools.
By studying these patterns, practicing on historical charts, and applying them in a structured way, you’ll enhance your ability to read the market and make smarter trading decisions.
Candlestick mastery doesn’t happen overnight, but with consistency and discipline, it can become one of your greatest trading assets.