Introduction
Moving averages are among the most widely used technical indicators in trading. They help traders smooth out price data, identify trends, and generate potential buy or sell signals. Two of the most common types are the Simple Moving Average (SMA) and the Exponential Moving Average (EMA).
In this article, we will explore the purpose of moving averages, compare SMA and EMA, and show how to use them in trading strategies effectively.
What is a Moving Average?
A moving average is a mathematical calculation that averages a set of prices over a specific period of time. As each new data point becomes available, the average “moves” forward, hence the name.
Key Purposes:
- Trend Identification: Helps determine the general direction of the market.
- Noise Reduction: Smooths out price fluctuations to highlight underlying movements.
- Signal Generation: Can act as dynamic support/resistance or as a basis for entry/exit signals.
Types of Moving Averages
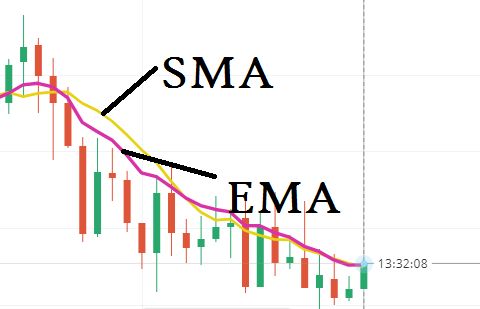
1. Simple Moving Average (SMA)
The SMA calculates the average of closing prices over a set period. For example, a 10-day SMA sums the last 10 closing prices and divides by 10.
Pros:
- Easy to understand and use
- Smooth and less sensitive to short-term fluctuations
Cons:
- Reacts slowly to price changes
- Can lag during fast market conditions
2. Exponential Moving Average (EMA)
The EMA gives more weight to recent prices, making it more responsive to new data.
Pros:
- Faster reaction to recent price action
- Better suited for short-term trading and fast markets
Cons:
- May generate more false signals due to sensitivity
- Less smooth than SMA
SMA vs. EMA: Key Differences
| Feature | SMA | EMA |
|---|---|---|
| Calculation | Equal weight for all periods | More weight on recent prices |
| Responsiveness | Slower | Faster |
| Use Case | Long-term trend analysis | Short-term signal detection |
| Appearance | Smoother line | More dynamic line |
Popular Moving Average Periods
- Short-term: 9, 10, or 20-period MAs – used for quick trades
- Medium-term: 50-period MA – identifies the main trend
- Long-term: 100 or 200-period MA – used for broader market direction
How to Use Moving Averages in Trading
1. Trend Identification
- Price above MA: Indicates an uptrend
- Price below MA: Indicates a downtrend
- Use multiple MAs (e.g., 50 and 200) to confirm the trend direction
2. Support and Resistance
- Moving averages can act as dynamic support or resistance
- In an uptrend, price often bounces off the MA
- In a downtrend, price often rejects the MA from below
3. Crossovers (Buy/Sell Signals)
a) Golden Cross:
- When a shorter MA (e.g., 50 EMA) crosses above a longer MA (e.g., 200 EMA)
- Indicates a bullish trend
b) Death Cross:
- When a shorter MA crosses below a longer MA
- Indicates a bearish trend
4. Combining with Other Indicators
- Combine MAs with indicators like RSI, MACD, or Volume to filter signals
- Example: Enter a trade when a crossover happens and RSI confirms overbought/oversold conditions
Example Trading Strategy Using EMA
EMA Crossover Strategy (15 EMA vs. 50 EMA):
- Buy Signal: 15 EMA crosses above 50 EMA + price above both
- Sell Signal: 15 EMA crosses below 50 EMA + price below both
- Stop-loss: Just below the most recent swing low/high
- Take-profit: Based on risk/reward ratio or a support/resistance level
Common Mistakes to Avoid
- Over-relying on one MA: Always confirm with price action or other indicators
- Using MAs on low-volume assets: They’re less effective when the market is choppy
- Forcing entries: Not every crossover is a valid signal—look for confluence
Best Practices
- Test different timeframes for your strategy (e.g., 1H, 4H, Daily)
- Backtest your MA strategy on historical data
- Use EMA for speed, SMA for reliability
- Keep your chart clean—avoid using too many MAs at once
Conclusion
Moving averages are powerful tools that offer clarity in the often chaotic world of price action. Understanding the differences between the Simple Moving Average (SMA) and the Exponential Moving Average (EMA) enables traders to choose the right tool for their strategy and trading style.
Whether you’re spotting trends, looking for entry signals, or confirming price behavior, moving averages can significantly enhance your technical analysis. Like all tools, they work best when used with other indicators and solid risk management.